Roku Inc. is a prominent TV streaming company with two main segments: Platform and Devices. The Platform segment is focused on providing users with a platform that enables them to discover and watch a wide range of TV content.
Roku generates revenue from this segment through various means, including digital ads and related services such as revenue sharing from subscriptions and transactions, promoting media and entertainment content, offering premium subscriptions, and selling branded buttons on remote controls.
As of the last trading session, Roku’s share price stands at $97.49, indicating a 1.27% increase. The company’s market capitalization currently stands at $13.8 billion, calculated by multiplying the current share price by the total number of outstanding shares, which is 164.7 million.
The PE ratio (Price-to-Earnings ratio) for Roku’s stock is -20.1. A negative PE ratio is unusual and may indicate either negative earnings or losses in the trailing twelve months. It’s essential to investigate the reason behind the negative PE ratio to understand the company’s financial situation better.
Additionally, Roku’s price-to-sales ratio is 4.04. The price-to-sales ratio is a valuation metric that helps investors assess the company’s stock price relative to its revenue per share. A lower ratio may suggest that the stock is undervalued relative to its sales, but it’s crucial to consider other factors before drawing conclusions solely based on this metric.
As with any investment decision, it’s essential to conduct a thorough analysis of Roku’s financial performance, business prospects, industry trends, and overall market conditions.
Consulting with financial experts and conducting your due diligence will help you make informed decisions regarding Roku stock or any other investment. Remember that all investments carry inherent risks, and past performance is not indicative of future results.
The Roku stock market
According to the derivatives data for Roku stock, the current implied volatility in the market is 60.08%. Implied volatility is a measure of market expectations for future price fluctuations of the underlying asset, in this case, Roku stock. A higher implied volatility suggests that the market expects more significant price swings in the future.
Furthermore, the implied volatility has decreased by 3.34% in the last trading session. A decrease in implied volatility typically indicates a potential decrease in market uncertainty or a reduction in expected price swings.
As of now, there are 346.784K open interest contracts in the derivatives market for Roku stock. Open interest refers to the total number of outstanding options contracts that have not been closed or exercised.
The PUT/CALL ratio for Roku stock is 0.96. The PUT/CALL ratio compares the total number of put options (bearish bets) to the total number of call options (bullish bets) in the market. A ratio below 1, as in this case, indicates a higher number of bullish sentiment or more optimistic expectations among market participants.
Please note that implied volatility and other derivatives data are dynamic and can change rapidly with market conditions. Traders and investors use this data to assess market sentiment and make informed decisions about their trading strategies. However, it’s essential to consider this data alongside other fundamental and technical analysis to make well-rounded investment decisions.
Roku’s share price analysis reveals a significant journey in recent times. After reaching its peak in July 2021, the stock entered a long correction phase, declining by almost 90%. During this correction phase, the price formed lower highs and lower lows, indicating a bearish trend from August 2021 to December 2022.
Roku Stock Price Prediction Using Price Action Strategy
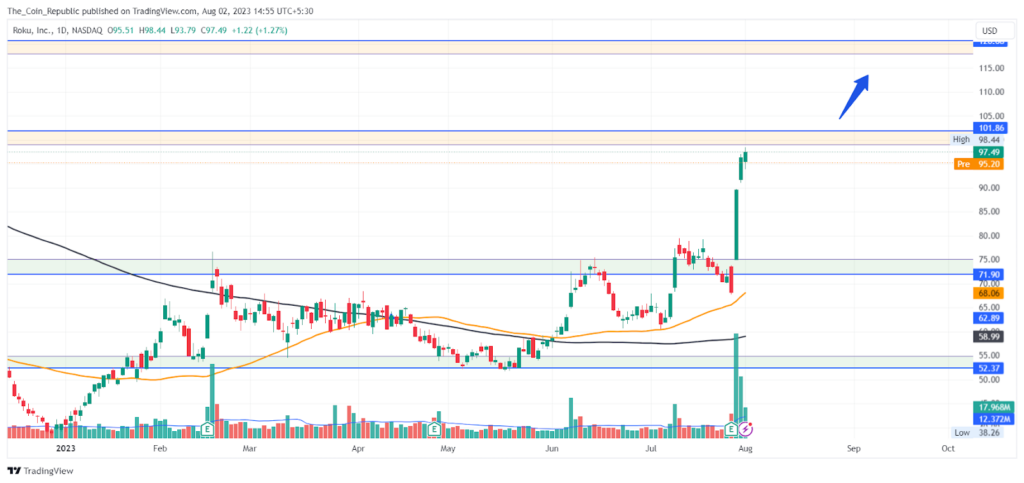
However, in 2023, the stock experienced a remarkable turnaround, gaining momentum right from the beginning of the year. This shift led to an uptrend, and the price started forming higher lows and higher highs, signifying a bullish trend.
Furthermore, the recent disclosure of positive results had a substantial impact on the stock price, causing it to surge by approximately 38% over the past four trading sessions. As the price nears the $100 mark, there is a possibility that it could act as a psychological barrier, leading to profit booking by some investors.
The key scenario to watch is whether the stock faces significant profit booking near the $100 mark and whether it can sustain its position in that zone. If the stock manages to hold its ground near this level and does not experience a major sell-off, it might indicate strong support and potential for further upside. A breakout above this zone could lead to additional gains for Roku investors, potentially adding more value to their portfolios.
However, as with any investment, it’s essential to consider the risks involved and conduct a comprehensive analysis of Roku’s financials, market conditions, and other relevant factors before making any investment decisions. Price movements in the stock market can be volatile, and past performance is not indicative of future results.
Conclusion
Roku stock price prediction concludes that the stock was in a correction phase for the past 17-18 months and declined almost 90% after topping out. However, the year 2023 came out to be a very fruitful year as the stock gained momentum from the very start and shifted its trend to an uptrend. Recently, the disclosure of results trusted the stock price with momentum surging nearly 40% in the past 4 days.
Now, the stock is nearing a barrier of the $100 mark which might halt the stock price leading to a profit booking. However, if the stock does not suffer major rejections from the resistance and starts sustaining near the zone then the stock may try to continue with the flow and add some more returns in the portfolio of its Investors.